
We’ve already shared about the useful resources at NYS KWIC (Kids Well-being Indicators Clearinghouse), but we’re excited to share that even more data on children is now available from this handy site. You can now find relevant data at a larger number of geographic levels, including school districts, New York State Assembly/Senate districts, Congressional districts, and county subdivisions. KWIC has also released an exciting new Map Builder tool.
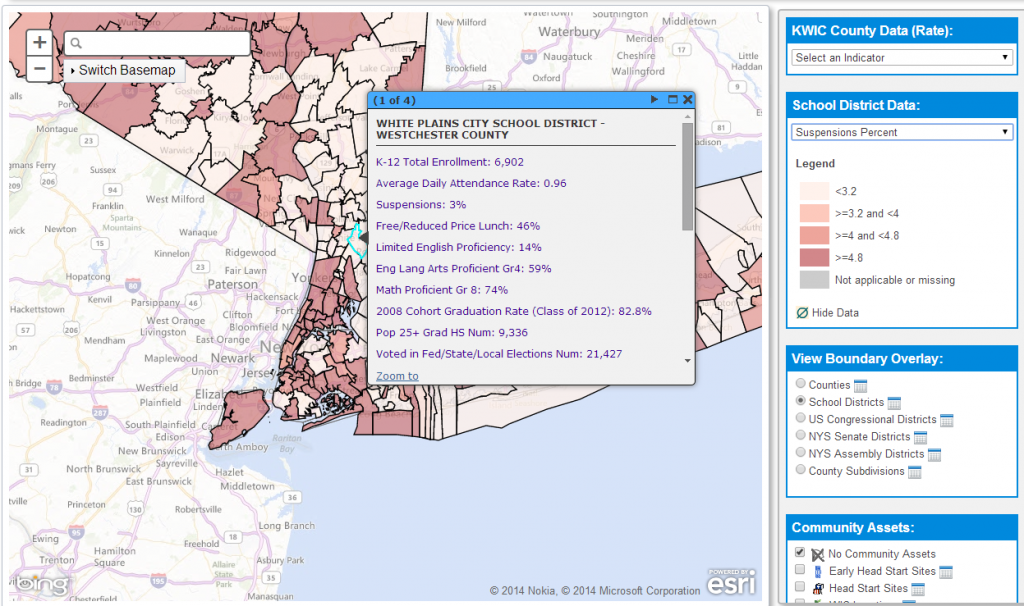
Here’s an example of what you can do with the Map Builder. I selected “school district” for the geographic boundary and “suspension rate” for the indicator. And just like that, the shaded results were mapped out for each school district! You can click on a particular school district (such as White Plains, in the example below) to see the full data set that is available for that geographic location.
A sampling of other types of data that you can see using the Map Builder:
- Average daily attendance rate
- Percent by race
- Diversity Index
- Number of kids 3+ in nursery/preschool
- Number of 12-year-olds
- Number of households below poverty level
- Number of people over 25 that are high school graduates
You’ll also want to check out another one of our favorite KWIC tools: the county report. You can use this tool to automatically generate Westchester County reports covering a variety of issues. Indicator domains include: child well-being, child welfare, maternal/infant, and juvenile justice. You can also select “View All KWIC Indicators” to see all of the data that KWIC has at the Westchester County level.
We hope you find these tools useful as you look for more information about the children in your community. We certainly have!